Sales route planning and the beat plan
In short
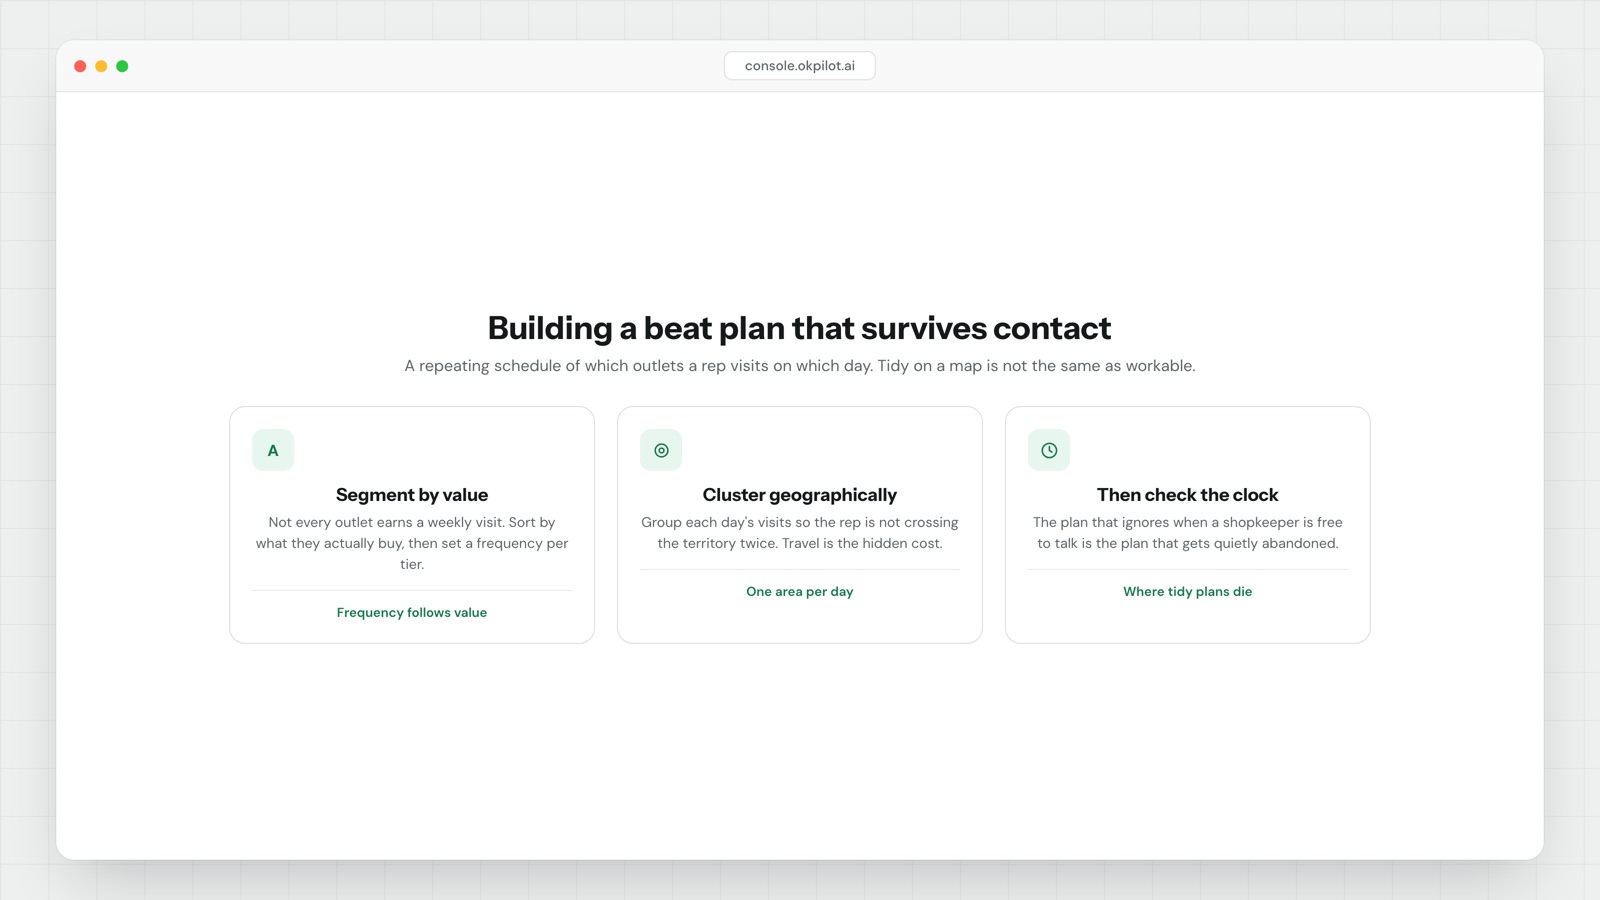
Sales route planning turns a list of outlets into a repeating schedule — a beat plan — saying which rep visits which shops on which day. Build it in three steps: set visit frequency from sell-through, cluster geographically, then fix the cycle.
Max visit interval = stock the outlet can hold ÷ units it sells per day
Calls needed per cycle    = Σ (outlets in segment × visits per cycle)
Calls available per cycle = reps × selling days × calls per day

The plan is only real if available ≥ needed × 1.15- A beat is one day's route. A cycle is how long it takes to visit every outlet once at its planned frequency, usually a week or a fortnight.
- Set frequency from stock cover, not from status. An outlet that sells out in four days needs a visit inside four days whatever tier you put it in.
- Cluster after you set frequency, not before. Geography is a constraint on the plan, not the basis of it.
- Do the capacity check before you publish. If needed calls exceed available calls, the plan fails quietly, as the last few outlets of every day being skipped.
- The usual failure is a tidy map that ignores the two things no map holds: the outlet's weekly closing day and the hour the owner is free to talk.
- Measure beat adherence and strike rate separately. They go wrong for different reasons and the fixes are opposite.
Step one: frequency from sell-through, not from tiers
Start by ranking every outlet on the last three months' offtake, highest to lowest, and plotting the running total. Cut the list where the curve flattens. Do not apply a borrowed 80/20 split; use the shape of your own curve, which differs by category and by town.
That gives you value tiers, not visit frequency. This is where most beat plans go wrong: frequency gets assigned by prestige. A-class weekly, B-class fortnightly, C-class monthly, because it feels orderly.
Frequency is really a stockout question:
Max visit interval = units of your SKU the outlet can physically hold
                     ÷ units it sells per day
A small shop with one shelf facing that holds eighteen units and sells six a day is empty on day three. Visit it monthly and you are selling it eight days of stock a month, not a month of stock. That loss never appears in your reports: a stockout arrives as nothing at all, and then as a competitor's product in the facing.
Run that calculation and you will find a set of outlets whose required interval is shorter than any rep can economically serve. The answer for them is not more visits: it is a bigger facing, a standing telephone order, or a distributor drop between visits.
Step two: cluster, then fix the cycle
Now the geography. A beat is one contiguous cluster a rep can finish in a day, and the test is the travel share:
- Aim for travel well under a quarter of working time, and measure your own before trusting any target. If reps spend a third of the day driving, the clusters are too wide and reordering stops will not fix it.
- Beats should not cross. Two reps in the same market on different days is normal; the same street twice in one cycle is waste unless a frequency rule demands it.
- Handle fortnightly outlets as alternating beats on the same weekday — Tuesday Week A, Tuesday Week B — so the weekday stays stable. Shopkeepers learn "the rep comes Tuesday", which is worth more than a marginally shorter drive.
- Leave one unassigned slot per rep per day for a follow-up, a complaint or a new outlet. A plan with no slack gets abandoned in week two.
Fixing the cycle buys predictability both ways. The rep knows where tomorrow is, the shopkeeper knows when to have the order list ready, and the office knows where a rep should be at eleven.
Step three: the arithmetic most sales route planning skips
Most beat plans are never checked against the hours available, which is why they fail in the third week.
Calls per day = (working minutes − travel minutes − admin minutes)
                ÷ minutes per call
Measure minutes per call from real visits, separately by segment. An A-class call with a stock count, a display fix and an order is not a C-class top-up, and averaging them gives a plan that is wrong at both ends.
Then the two totals:
Calls available per cycle = reps × selling days per cycle × calls per day
Calls needed per cycle    = Σ (outlets in segment × visits per cycle)
If needed exceeds available, you have three levers and only three: cut frequency on the lowest-value segment, tighten clusters to buy back travel minutes, or add a rep. Choosing none of them does not make the problem go away. It converts it into skipped calls at the end of every day, concentrated on the outlets furthest out.
Build in roughly fifteen per cent slack. Sick days, festivals, closed shutters and a rep stuck in a long negotiation are not exceptions, they are Tuesday.
The failure mode: a tidy map and a closed shutter
A route optimiser knows distance. It does not know:
- The weekly closing day. Most markets have one and it is not the same for every outlet or every street.
- When the owner is at the counter. The person who can place an order is often not the person behind the till all day. A call that reaches the counter staff and not the owner is a call you will make twice.
- The outlet's own peak hour. Nobody discusses a new SKU with six customers queueing.
- Goods-in time. Early morning is for receiving stock, cleaning and cash. You are an interruption.
- The cash cycle. Plenty of outlets order right after their own best sales day, because that is when there is money in the drawer. Call the day before and you get a conversation. Call the day after and you get an order.
So before you optimise for distance, add two fields to every outlet record — closing day, and best call window — and treat them as hard constraints the clustering has to work around. A beat that drives ten per cent further but reaches every outlet when the owner is free will beat the tidy one, and the difference shows up in strike rate rather than in kilometres.
The same logic applies within the day. Put the calls that need a decision-maker inside their window and fill the gaps around them with the calls that do not. A rep who hits the biggest outlet in the territory at four in the afternoon because it was last on the loop is a planning failure, not a discipline problem.
Keeping the beat plan honest
Track two numbers, never one:
Beat adherence = calls made on the planned beat ÷ calls planned
Strike rate    = calls that produced an order ÷ calls made
Read them together. Low adherence with a high strike rate means the plan is wrong and the rep found better calls — go and look at what they found. High adherence with a low strike rate means the plan is being followed and the segmentation or the call windows are wrong. Chasing adherence alone hides the first case, which is the more useful of the two.
Review the segmentation quarterly against actual offtake, because outlets move between tiers faster than people expect. Redraw the geography rarely. Every redraw costs you the relationships a rep spent months building, and the driving you save almost never pays for that.
Sequencing the stops is the easy half. Deciding who goes where, on which day, and at what hour is the plan.
If the beat plan lives in a spreadsheet, nobody can tell whether it was followed. OkPilot holds the plan, the closing day and the call window, and records who was actually where, so adherence and strike rate are counted rather than estimated — see field sales management software and, on the difference between ordering stops and running a day, route planner or dispatch software.
See OkPilot running your own operation
A live walkthrough with a real person, configured to your jobs on the call. About ten minutes. Setup takes around 48 hours.