What last-mile delivery actually means when you run the vans
In short
The last mile is the final leg of a shipment, from the local depot to the customer's door. A last mile provider is the carrier that owns that leg: the vans, the drivers, the proof of delivery, and the cost of every failed attempt. It is the most expensive leg per unit moved because the work stops being transport and becomes a sequence of individual stops.
Cost per successful stop
= (total route cost ÷ stops attempted) ÷ first-attempt success rate- Every leg before the last one moves freight in bulk between two known points. The last mile moves one or two orders each to dozens of doors nobody has seen before.
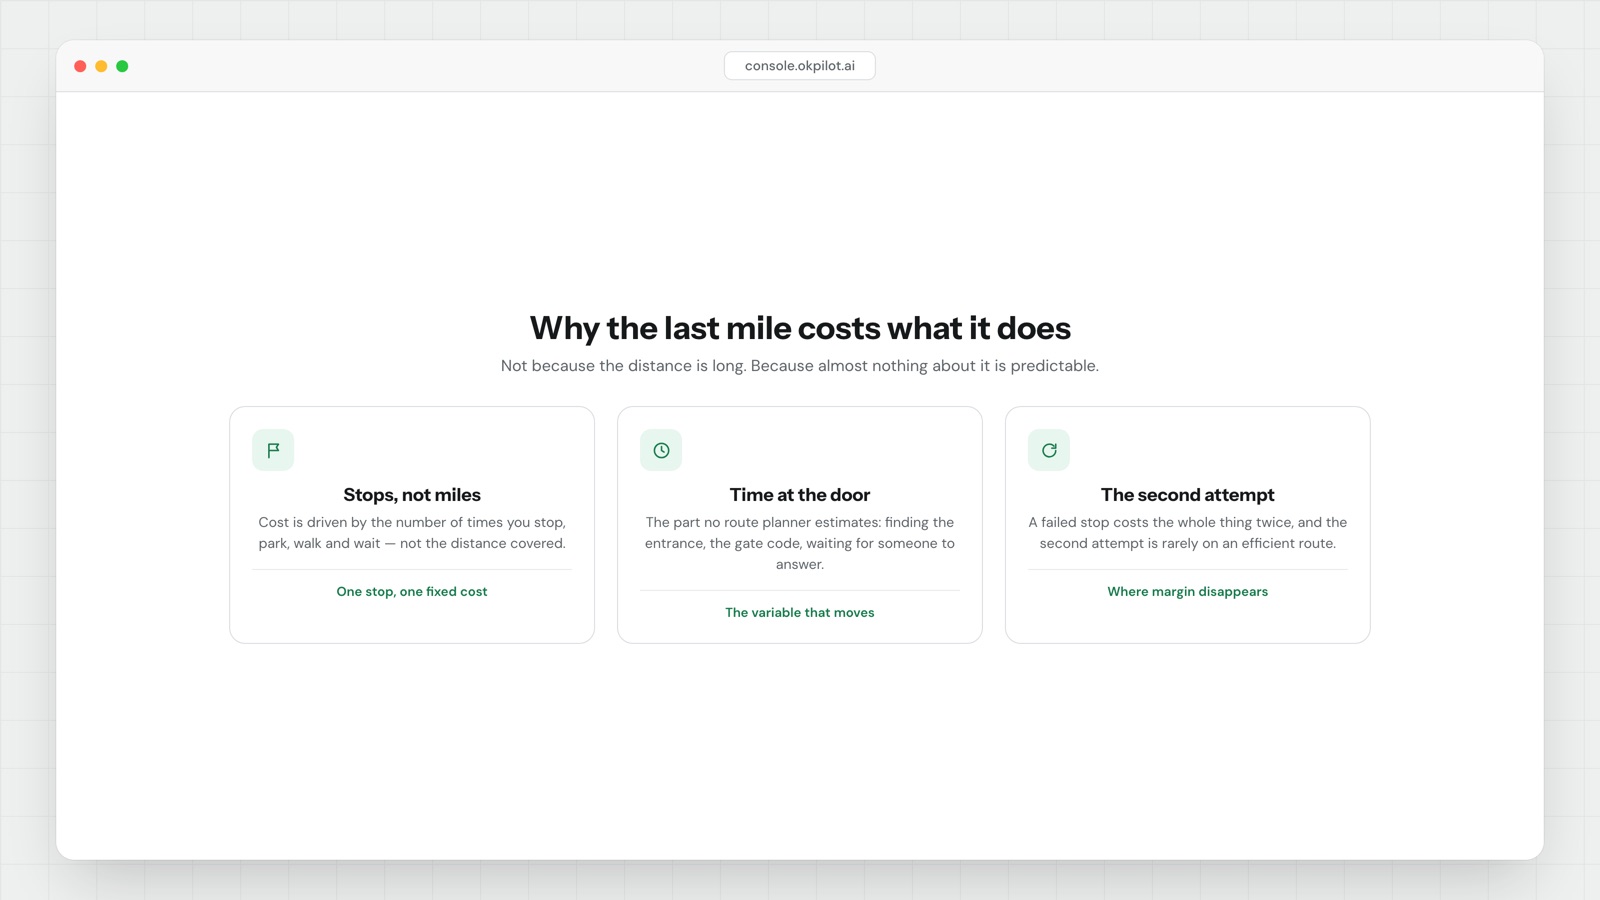
- Most of the time spent at a stop is not driving. It is parking, walking, finding the entrance, waiting, and capturing proof.
- A failed stop costs more than a successful one: the first attempt, the re-attempt, the customer contact, and sometimes a refund on top.
- Time windows, not distance, usually decide how many stops fit into a shift.
- The last mile absorbs every upstream mistake — bad address, mis-sort, late trunk arrival — and has nobody downstream to pass them to.
What is a last mile provider, and what you are actually buying
A last mile provider is whoever turns a parcel sitting in a local depot into a parcel sitting with the customer. That comes in three shapes, and they fail in different ways.
Your own vans. You hold the fleet cost, the driver cost and the variance. You also hold the information: your driver learns that the gate code at number 14 is on the second keypad, and that knowledge stays in your operation.
A contracted last mile carrier. You pay per stop or per parcel. The fleet risk moves to them. Before you sign, find the clause about re-attempts and read it twice. If attempt two is billed at the same rate as attempt one, you are paying for their failure rate, and you have no way to audit it unless the contract gives you attempt-level data rather than monthly delivery percentages.
A gig or crowdsourced pool. Capacity flexes with demand, which solves the Friday problem. What you lose is the repeat driver. Nobody accumulates knowledge about your addresses, so every stop is a first visit forever.
The useful question is not which model is cheapest per stop on paper. It is which model absorbs the failed attempt, because that is where the money actually goes.
Why the last mile costs more than everything before it
You will see a lot of articles quote a percentage here. Most of those numbers trace back to nothing checkable, so here are the mechanical reasons instead. They hold in every operation, and you can see each one in your own data.
- Drop density collapses. A trunk run is one origin, one destination, one gate, one piece of paperwork, twenty tonnes. A 62-stop van day is 62 arrivals, 62 chances to be at the wrong door, and 62 separate pieces of proof.
- The fixed cost per stop is mostly not driving. In a dense urban round, the walk from the parked van to the door and back can take longer than the drive from the previous stop. Routing software shortens the part that was already short.
- Failure is asymmetric. Nothing upstream fails per unit. A linehaul either runs or it doesn't. In the last mile, a single stop can fail while the other 61 succeed, and that one failure generates a second attempt, a phone call, and an email thread.
- Time windows remove your freedom to sequence. Each promised window cuts the number of legal orderings. Enough of them and the route is no longer something you optimise, it is something you survive.
- Demand is spiky but shifts are not. You cannot staff a van for four hours.
- It is the end of the line. When the sort is late, the last mile starts late and still owns the promise.
Routing is mostly solved. Getting inside is not, which is why the twenty minutes at the door never shows up in anyone's efficiency report.
We wrote about that gap in more detail in routing is solved, getting inside is not.
Cost per stop, and the moment it stops being predictable
Here is the arithmetic. The numbers are illustrative, so put your own in.
A van day: driver for the shift 160, plus vehicle, fuel, insurance and amortisation at 70. Route cost 230. Stops attempted, 62.
Cost per attempted stop = 230 ÷ 62        = 3.71
Successful stops at 91% = 62 × 0.91       = 56.4
Cost per successful stop = 230 ÷ 56.4     = 4.08
Now add the re-attempts. The 5.6 failures come back tomorrow and consume 5.6 more attempts at 3.71 each, which is 20.78 of someone's van day.
True cost per delivered order = (230 + 20.78) ÷ 56.4 = 4.45The headline number is 3.71. The real number is 4.45, a fifth higher. Most operations quote themselves the first one, because attempts are easy to count and re-attempts get folded into tomorrow's route cost where nobody sees them.
That is the first half of the problem. The second half is variance. Average dwell time is close to useless, because the average stop is not what breaks your day — the long tail is. Take a week of completed stops, measure the time from arrival to completion for each, sort them, and look at the median against the ninetieth percentile. If your median stop is four minutes and your ninetieth is eighteen, then one stop in ten is eating three others, and no amount of route optimisation touches it.
A diagnostic you can run this week
You need timestamps, which you have if your drivers complete jobs in an app, and you can reconstruct roughly from fuel cards and delivery notes if they don't.
- Pull thirty completed stops from one busy round.
- For each, record arrival time, completion time and the drive time from the previous stop.
- Compute total dwell against total drive time for the round.
- Sort the dwell times. Note the median and the ninetieth percentile.
- List every failed attempt with its actual reason: nobody home, wrong address, no access, refused, damaged, driver ran out of hours.
Then apply three rules.
- If total dwell exceeds total drive time, a better route planner is not your lever. Your lever is what happens between arriving and finishing.
- If the ninetieth percentile dwell is more than twice the median, you have an access and information problem, not a speed problem. Find the five worst stops and write down what went wrong at each.
- If "no access" and "nobody home" together account for most failures, the fix is upstream of the van: an honest ETA the customer actually sees, and access notes attached to the address rather than living in one dispatcher's head.
Nothing in that list requires software to measure. It does require software to fix at scale, because access notes and attempt reasons only help if they survive the handover to whoever shows up next. That is what delivery management software is for, and it is the part OkPilot does: the job's history stays attached to the address, proof is captured at the door as part of finishing the stop rather than as a separate step someone forgets, and you get attempt-level data instead of a monthly percentage.
The definition of the last mile is the easy part. The part worth your attention is that it is the only leg of the journey where cost per unit is set by information rather than distance.
See OkPilot running your own operation
A live walkthrough with a real person, configured to your jobs on the call. About ten minutes. Setup takes around 48 hours.